วิธีจับการลงหลัง Shitcoin Pump: แนวทางเชิงระบบ
นักเทรดคริปโตทุกคนเคยเห็นสิ่งนี้อย่างน้อยหนึ่งครั้ง: โทเคนที่ไม่มีใครรู้จักเมื่อวานกลับทำ +800% ภายใน 4 ชั่วโมง Twitter ระเบิดด้วยอีโมจิจรวด Reddit เต็มไปด้วยโพสต์ "นี่แค่จุดเริ่มต้น" เพื่อนร่วมงานของคุณ — ที่เมื่อเดือนที่แล้วยังแยกไม่ออกระหว่าง order book กับออเดอร์ McDonald's — ส่งข้อความมาว่า "เพื่อน โยนเข้าไปสักร้อยเหรียญเถอะ" สิบสองชั่วโมงต่อมา โทเคนร่วงลง 85% จากจุดสูงสุด ความเงียบงัน จรวดถูกลบแล้ว
คำถามไม่ใช่ว่า จะ มี dump หรือไม่ คำถามคือจะทำกำไรจากมันอย่างเป็นระบบโดยไม่ถูกบดขยี้จาก pump นั้นเองได้อย่างไร
บทความนี้ไม่ใช่คำแนะนำทางการเงิน (ข้อความปฏิเสธความรับผิดชอบที่จำเป็นซึ่งไม่มีใครอ่าน แต่ทนายความยืนกราน) มันคือการวิเคราะห์ทางเทคนิคของกลไก สัญญาณ และอัลกอริทึมสำหรับการระบุจุดกลับตัวหลังการเคลื่อนไหวแบบ impulse บนสินทรัพย์ที่มีสภาพคล่องต่ำ
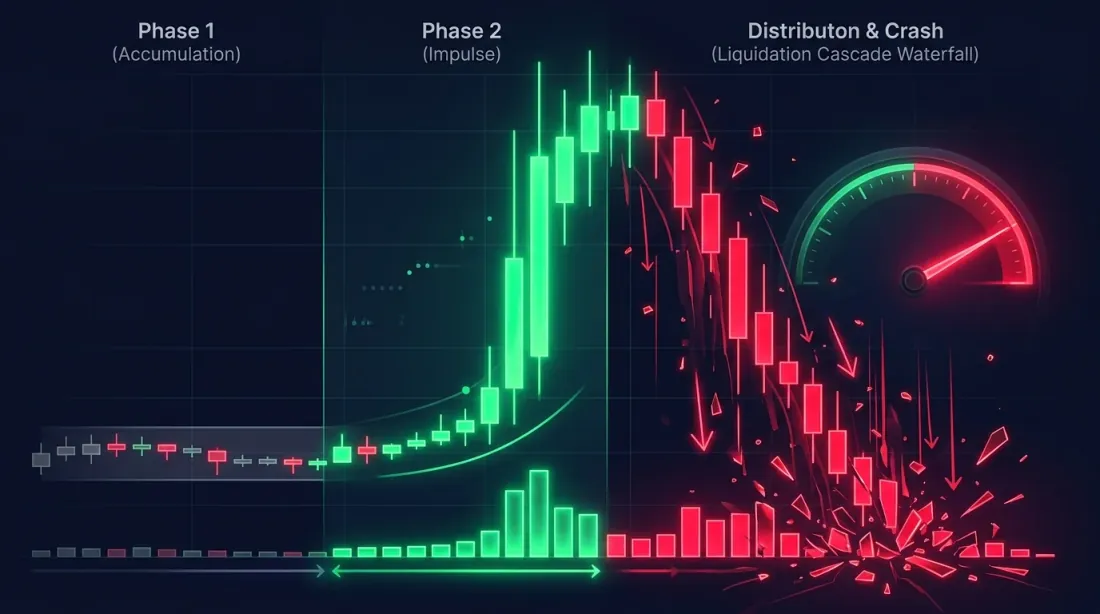
กายวิภาคของ Pump-and-Dump: สามช่วงของความวุ่นวาย
ก่อนจะ short คุณต้องเข้าใจโครงสร้างของปรากฏการณ์นี้ ทุก shitcoin pump-and-dump ผ่านสามช่วง แต่ละช่วงมีลายเซ็นข้อมูลที่เป็นเอกลักษณ์เฉพาะตัว
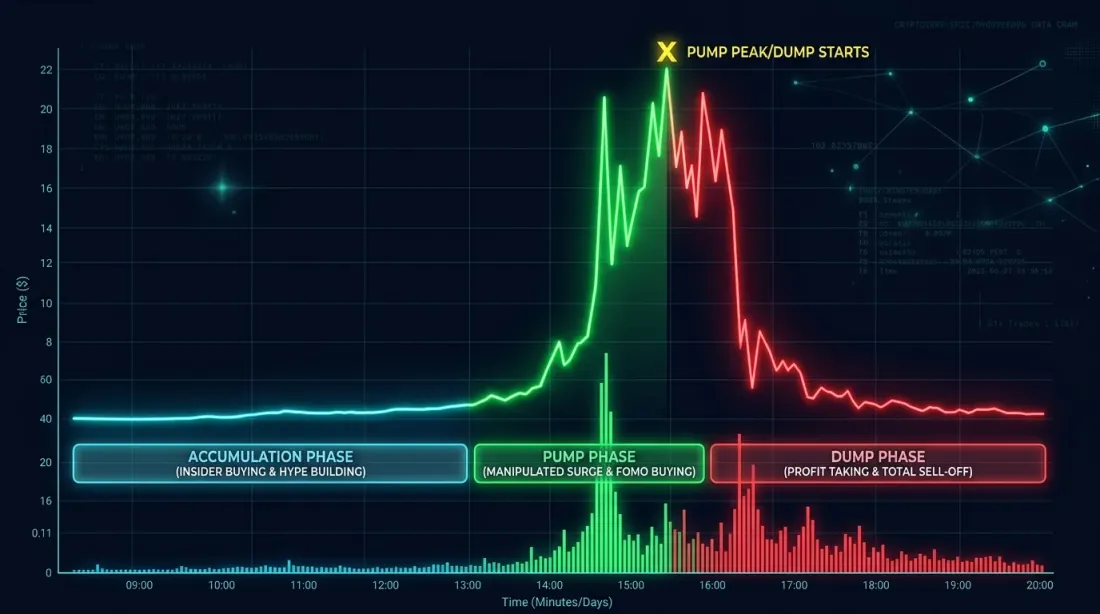
ช่วงที่ 1: การสะสม (การล่าอย่างเงียบงัน)
ระยะเวลา: ตั้งแต่หลายชั่วโมงถึงหลายวัน
บางคน — กลุ่ม insider, กลุ่ม Telegram ที่ประสานงานกัน หรือเพียงแค่ผู้เล่นรายใหญ่ที่มีข้อได้เปรียบด้านข้อมูล — เริ่มซื้อสะสมโทเคน ทำอย่างระมัดระวัง: ออร์เดอร์เล็กน้อย ผ่านหลายตลาด มักเกิดในช่วง Asian session (เมื่อสภาพคล่องน้อยที่สุดและความสนใจกระจัดกระจาย)
สิ่งที่มองเห็นในข้อมูล:
- ปริมาณการซื้อขายค่อยๆ เพิ่มขึ้น (50-200% สูงกว่าค่าเฉลี่ย 7 วัน) แต่ราคาแทบไม่เคลื่อน
- ด้าน bid ของ order book หนาขึ้น: "กำแพง" ปรากฏ 2-5% ต่ำกว่าราคาปัจจุบัน
- เมตริก on-chain (สำหรับโทเคน DEX): การโอนขนาดใหญ่ไปยังตลาด การเติบโตของกระเป๋าเงินผู้ซื้อที่ไม่ซ้ำกัน
- Funding rate บน perpetual futures (ถ้ามี) เริ่มเพิ่มขึ้นเล็กน้อย
ในช่วงนี้ ยังเร็วเกินไปที่จะ short คุณยังไม่รู้ว่านี่คือการสะสมหรือความสนใจแบบออร์แกนิก การแยกแยะทั้งสองอย่างมักเป็นไปไม่ได้ — ความแตกต่างจะชัดเจนก็ต่อเมื่อมองย้อนหลังเท่านั้น
ช่วงที่ 2: Impulse (งานปาร์ตี้)
ระยะเวลา: ตั้งแต่ 30 นาทีถึง 12 ชั่วโมง
ราคาทะลุแนวต้านสำคัญ และเกิด cascade ขึ้น Stop-loss ของผู้ขาย short ถูก liquidate FOMO (Fear Of Missing Out) ดูดนักเทรดรายย่อยเข้ามา Crypto Twitter กลายเป็น echo chamber ทุก retweet คือ long ที่ใช้ leverage 50x ตัวใหม่
ลายเซ็นที่เป็นเอกลักษณ์:
- Volume อยู่ที่ 1000-5000% สูงกว่าค่าเฉลี่ย (ไม่ใช่การพิมพ์ผิด)
- Funding rate พุ่งขึ้นสู่ 0.1-0.5% ต่อ 8 ชั่วโมง (ปกติคือ 0.01%)
- Open Interest เติบโตแบบ exponential: เปิดตำแหน่งใหม่เร็วกว่าที่ปิด
- Bid-ask spread กว้างขึ้น 3-10 เท่าเนื่องจากขาดสภาพคล่องด้าน ask
- Order book แสดงสุญญากาศด้านบน: ระหว่างราคาปัจจุบันและ ask ที่มีนัยสำคัญที่ใกล้ที่สุด — ความว่างเปล่า
การ short ในช่วงนี้คือการฆ่าตัวตาย มันเหมือนกับการยืนขวางรถไฟเพราะ "มันจะหยุดในที่สุด" ใช่ มันจะหยุด แต่ในตอนนั้นคุณจะถูก liquidate ไปแล้ว รายละเอียดเพิ่มเติมอยู่ในส่วน "สิ่งที่ไม่ควรทำ" ด้านล่าง
ช่วงที่ 3: การกระจายและการล่มสลาย (The Hangover)
ระยะเวลา: ตั้งแต่ 2 ถึง 48 ชั่วโมง
Insider เริ่มทำกำไร ราคาทำการแก้ไขครั้งแรกที่มีนัยสำคัญ (-15-30% จากจุดสูงสุด) นักเทรดรายย่อย "ซื้อ dip" ราคาเด้ง จากนั้นลงอีก การเด้งครั้งถัดไปอ่อนแอกว่า การลงแต่ละครั้งลึกกว่า
สิ่งที่เกิดขึ้นในข้อมูล:
- Volume ยังคงสูงแต่เปลี่ยนมาทางด้านขาย
- Funding rate เริ่มลดลงแต่ยังสูงผิดปกติ
- Open Interest หยุดเติบโตหรือเริ่มลดลง (long ปิด)
- ออร์เดอร์ขายตลาดขนาดใหญ่ปรากฏ "กิน" ผ่าน order book หลายระดับลงมา
- On-chain: การโอนขนาดใหญ่จากกระเป๋า insider ไปยังตลาด
นี่คือเขตล่า นี่คือจุดที่งานเริ่มต้น
สัญญาณสำคัญสำหรับการเข้า Short
แต่ละสัญญาณเมื่อแยกกันนั้นอ่อนแอ การรวมกันสามอย่างขึ้นไปถือเป็นสมมติฐานที่ใช้ได้แล้ว
1. Funding Rate: ภาษีของความโลภ
Funding rate คือต้นทุนการถือตำแหน่งบน perpetual futures เมื่อทุกคนต้องการ long ผู้ถือ long จ่ายให้ผู้ถือ short ยิ่ง rate สูง ตลาดยิ่งเอียงไปด้านเดียวมากขึ้น
| Funding Rate (ต่อ 8 ชั่วโมง) | การตีความ | การดำเนินการ |
|---|---|---|
| 0.01% | ปกติ | ไม่มีอะไร |
| 0.03-0.05% | ความต้องการ long สูงขึ้น | เฝ้าดู |
| 0.05-0.1% | การเอียงอย่างแข็งแกร่ง | พร้อม short |
| 0.1-0.3% | การเอียงสุดขีด | หาจุดเข้าอย่างจริงจัง |
| > 0.3% | ความบ้าคลั่ง | Short พร้อมการยืนยัน |
ทำไมถึงได้ผล: ที่ funding rate 0.3% ต่อ 8 ชั่วโมง ผู้ถือ long จ่าย ~1% ต่อวันเพียงเพื่อถือตำแหน่ง ที่ leverage 10x นั่นคือ 10% ของทุนต่อวัน สิ่งนี้ไม่สามารถดำเนินต่อไปได้นาน — ตำแหน่งเริ่มปิด กดราคาลง
ข้อควรระวัง: funding ที่สุดขีดเพียงอย่างเดียวไม่ใช่สัญญาณ short มันสามารถยังคงสูงได้เป็นชั่วโมงหรือแม้แต่วัน ขณะที่ราคายังคงเพิ่มขึ้น Funding คือตัวกรอง (การยืนยันการเอียง) ไม่ใช่ตัวกระตุ้น (จุดเข้า)
def funding_rate_signal(
    current_rate: float,
    historical_rates: list[float],
    lookback: int = 90,  # 90 periods = 30 days
) -> dict:
    """
    Assess the anomaly level of the current funding rate.

    Returns:
        signal: 'neutral' | 'elevated' | 'extreme' | 'insane'
        z_score: float — deviation from the norm
        percentile: float — percentile in historical data
    """
    import numpy as np

    hist = np.array(historical_rates[-lookback:])
    mean = hist.mean()
    std = hist.std()

    z_score = (current_rate - mean) / std if std > 0 else 0
    percentile = np.searchsorted(np.sort(hist), current_rate) / len(hist)

    if z_score > 4:
        signal = 'insane'
    elif z_score > 3:
        signal = 'extreme'
    elif z_score > 2:
        signal = 'elevated'
    else:
        signal = 'neutral'

    return {
        'signal': signal,
        'z_score': round(z_score, 2),
        'percentile': round(percentile, 4),
        'annualized_cost': round(current_rate * 3 * 365 * 100, 1),  # % annualized
    }
2. Open Interest: ใครติดกับดัก
Open Interest (OI) คือจำนวนรวมของสัญญา futures ที่เปิดอยู่ เมื่อ OI เพิ่มขึ้นพร้อมกับราคา — ผู้เข้าร่วมใหม่กำลังเข้าสู่ตลาด (ส่วนใหญ่เป็น long) เมื่อราคาเริ่มลดลงแต่ OI ยังคงสูง — long เหล่านั้นติดกับดัก การ liquidation ของพวกเขาจะเป็นเชื้อเพลิงของ dump
รูปแบบสำคัญ:
| ราคา | OI | การตีความ |
|---|---|---|
| เพิ่มขึ้น | เพิ่มขึ้น | Long ใหม่เข้า (pump กำลังดำเนินอยู่) |
| เพิ่มขึ้น | ลดลง | Short ปิด (short squeeze) |
| ลดลง | สูง | Long ติดกับดัก (ศักยภาพ dump) |
| ลดลง | ลดลง | Long ปิด (dump กำลังดำเนินอยู่) |
ช่วงเวลาที่อันตรายที่สุดสำหรับ long และดีที่สุดสำหรับ short: ราคาเริ่มลดลงแต่ OI ยังอยู่ที่จุดสูงสุด หมายความว่า long ที่เปิดอยู่ยังไม่ปิด — พวกเขายังหวังว่าจะมีการเด้งกลับ เมื่อความหวังหมดลง liquidation cascade ก็เริ่มขึ้น
def oi_divergence_signal(
    prices: list[float],
    oi_values: list[float],
    window: int = 12,  # 12 candles (e.g., 12 x 5 min = 1 hour)
) -> dict:
    """
    Detect price/OI divergence.

    Bullish OI divergence: price falling, OI high — longs are trapped.
    """
    import numpy as np

    recent_prices = np.array(prices[-window:])
    recent_oi = np.array(oi_values[-window:])

    price_change = (recent_prices[-1] - recent_prices[0]) / recent_prices[0]
    oi_change = (recent_oi[-1] - recent_oi[0]) / recent_oi[0]

    oi_at_peak = recent_oi[-1] > np.percentile(oi_values, 90)
    price_declining = price_change < -0.03  # price dropped by 3%+

    trapped_longs = oi_at_peak and price_declining

    if len(oi_values) > window * 2:
        oi_velocity = oi_change / max(abs(price_change), 0.001)
    else:
        oi_velocity = 0

    return {
        'trapped_longs': trapped_longs,
        'oi_percentile': round(
            np.searchsorted(np.sort(oi_values), recent_oi[-1]) / len(oi_values), 2
        ),
        'price_change': round(price_change * 100, 2),
        'oi_change': round(oi_change * 100, 2),
        'oi_velocity': round(oi_velocity, 2),
    }
3. การวิเคราะห์ Volume: ความจริงในแต่ละ Tick
Volume คือตัวบ่งชี้ตลาดเพียงอย่างเดียวที่ปลอมแปลงไม่ได้ (ก็เกือบ — wash trading บนตลาดบางแห่งยังคงเป็นความจริง แต่ตลาดชั้นนำได้ปรับปรุงการต่อสู้กับมันมากขึ้น)
สัญญาณสำหรับการ short:
Volume ที่ลดลงในช่วงการเด้งขึ้น สัญญาณคลาสสิกของความอ่อนแอ ราคาทำจุดสูงใหม่ แต่ volume ของการเคลื่อนไหวนั้นต่ำกว่าครั้งก่อน ผู้ซื้อกำลังหมดแรง
Volume พุ่งสูงในช่วงการลง ถ้าการแก้ไข -10% เกิดขึ้นบน volume ที่เกินกว่า volume ของการเด้งครั้งล่าสุด — ผู้ขายได้คว้าความคิดริเริ่มแล้ว
Breakout ปลอมพร้อม volume ต่ำ ราคาทะลุ high ในพื้นที่ แต่ volume ของ breakout ต่ำกว่าค่าเฉลี่ย 2-3 เท่า นี่คือกับดักสำหรับผู้ซื้อ: ราคากลับมาอย่างรวดเร็ว
def volume_exhaustion_signal(
    candles: list[dict],  # [{open, high, low, close, volume, timestamp}, ...]
    pump_start_idx: int,
) -> dict:
    """
    Volume exhaustion analysis after a pump.
    """
    import numpy as np

    pump_candles = candles[pump_start_idx:]

    up_candles = [c for c in pump_candles if c['close'] > c['open']]
    down_candles = [c for c in pump_candles if c['close'] <= c['open']]

    if not up_candles or not down_candles:
        return {'signal': 'insufficient_data'}

    avg_up_vol = np.mean([c['volume'] for c in up_candles])
    avg_down_vol = np.mean([c['volume'] for c in down_candles])

    up_volumes = [c['volume'] for c in up_candles]
    if len(up_volumes) >= 3:
        first_half = np.mean(up_volumes[:len(up_volumes)//2])
        second_half = np.mean(up_volumes[len(up_volumes)//2:])
        volume_degradation = (second_half - first_half) / first_half
    else:
        volume_degradation = 0

    all_volumes = np.array([c['volume'] for c in candles])
    vol_mean = all_volumes[:-len(pump_candles)].mean() if len(candles) > len(pump_candles) else all_volumes.mean()
    vol_std = all_volumes[:-len(pump_candles)].std() if len(candles) > len(pump_candles) else all_volumes.std()
    current_z = (pump_candles[-1]['volume'] - vol_mean) / vol_std if vol_std > 0 else 0

    return {
        'sell_buy_volume_ratio': round(avg_down_vol / max(avg_up_vol, 1), 2),
        'volume_degradation_pct': round(volume_degradation * 100, 1),
        'current_volume_z_score': round(current_z, 2),
        'signal': 'exhaustion' if volume_degradation < -0.3 else 'active',
    }
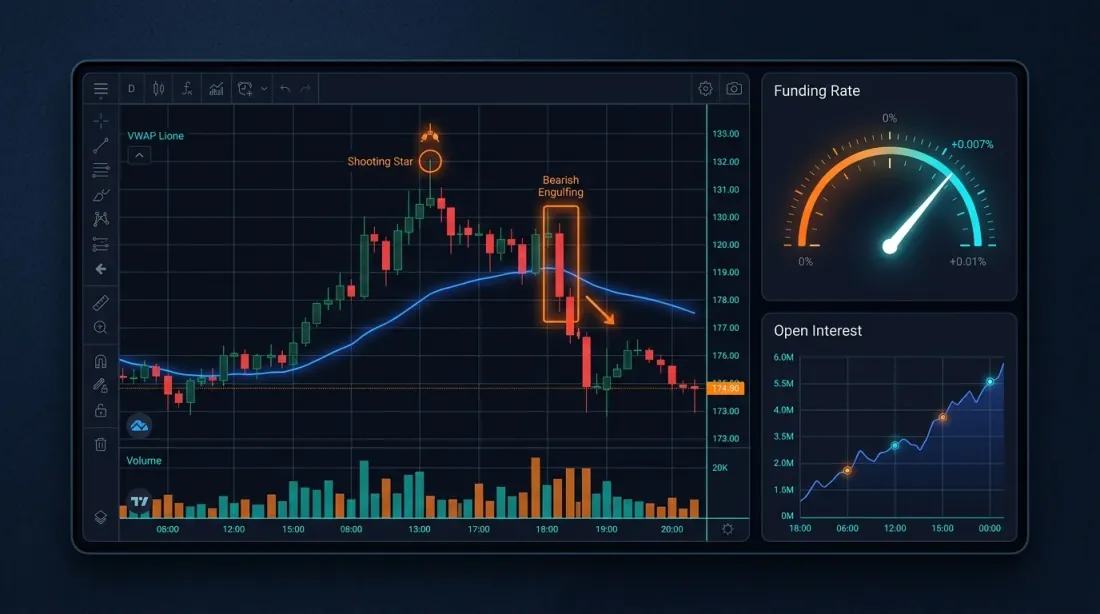
4. รูปแบบแท่งเทียน: สูตรเก่าที่ยังใช้ได้ผล
ใช่ การวิเคราะห์แท่งเทียนมีมาตั้งแต่ศตวรรษที่ 17 Munehisa Homma และ futures ข้าว ใช่ 90% ของ "กลยุทธ์แท่งเทียน" บน YouTube เป็นขยะ แต่บน timeframe 5 นาทีและ 15 นาที หลัง pump รูปแบบบางอย่างมีอำนาจทำนายที่มีนัยสำคัญทางสถิติ เหตุผลนั้นง่าย: มันสะท้อนโครงสร้างย่อยที่แท้จริง — การส่งมอบการควบคุมจากผู้ซื้อไปยังผู้ขาย
รูปแบบที่ควรติดตาม:
| รูปแบบ | คำอธิบาย | ความน่าเชื่อถือหลัง pump |
|---|---|---|
| Shooting Star | เงาบนยาว, ตัวเทียนเล็กที่ด้านล่าง | สูง |
| Bearish Engulfing | แท่งแดงครอบคลุมแท่งเขียวก่อนหน้าอย่างสมบูรณ์ | สูง |
| Evening Star | 3 แท่ง: เขียวใหญ่ -> เล็ก (doji) -> แดงใหญ่ | สูงมาก |
| Gravestone Doji | เปิด = ปิด ที่ด้านล่าง, เงาบนยาว | ปานกลาง |
| Three Black Crows | แท่งแดงสามแท่งติดต่อกันที่มีการปิดลดลง | สูง (การยืนยัน) |
สำคัญมาก: รูปแบบโดยไม่มีบริบทคือสัญญาณรบกวน Shooting Star ที่การดึงกลับแบบสุ่มไม่มีความหมาย Shooting Star ที่จุดสูงสุดของ pump พร้อม funding rate ผิดปกติและ OI divergence — นั่นเป็นเรื่องราวที่แตกต่างอย่างสิ้นเชิง
def detect_reversal_patterns(
    candles: list[dict],
    min_upper_shadow_ratio: float = 2.0,  # shadow > 2x body for shooting star
) -> list[dict]:
    """
    Detect bearish reversal patterns.
    """
    signals = []

    for i in range(2, len(candles)):
        c = candles[i]
        body = abs(c['close'] - c['open'])
        upper_shadow = c['high'] - max(c['close'], c['open'])
        lower_shadow = min(c['close'], c['open']) - c['low']
        total_range = c['high'] - c['low']

        if total_range == 0:
            continue

        if (upper_shadow > body * min_upper_shadow_ratio
            and lower_shadow < body * 0.5
            and c['close'] < c['open']):  # bearish
            signals.append({
                'pattern': 'shooting_star',
                'index': i,
                'timestamp': c['timestamp'],
                'strength': upper_shadow / total_range,
            })

        prev = candles[i - 1]
        if (prev['close'] > prev['open']  # previous is bullish
            and c['close'] < c['open']      # current is bearish
            and c['open'] > prev['close']   # opens above previous close
            and c['close'] < prev['open']): # closes below previous open
            signals.append({
                'pattern': 'bearish_engulfing',
                'index': i,
                'timestamp': c['timestamp'],
                'strength': body / (abs(prev['close'] - prev['open']) + 1e-10),
            })

        if i >= 2:
            c1 = candles[i - 2]
            c2 = candles[i - 1]
            c3 = candles[i]

            c1_body = abs(c1['close'] - c1['open'])
            c2_body = abs(c2['close'] - c2['open'])
            c3_body = abs(c3['close'] - c3['open'])

            if (c1['close'] > c1['open']        # first is bullish
                and c2_body < c1_body * 0.3      # second is small (doji)
                and c3['close'] < c3['open']     # third is bearish
                and c3_body > c1_body * 0.5      # third is large enough
                and c3['close'] < c1['close']):  # third closes below first's close
                signals.append({
                    'pattern': 'evening_star',
                    'index': i,
                    'timestamp': c['timestamp'],
                    'strength': c3_body / c1_body,
                })

    return signals
5. VWAP: สมอแห่งความเป็นจริง
VWAP (Volume-Weighted Average Price) คือราคาเฉลี่ยถ่วงน้ำหนักด้วย volume Anchored VWAP จากจุดเริ่มต้นของ pump แสดงราคาเข้าเฉลี่ยสำหรับผู้เข้าร่วมทั้งหมดที่ซื้อในช่วง impulse
ทำไมถึงสำคัญ: เมื่อราคาลดลงต่ำกว่า anchored VWAP — ผู้ซื้อโดยเฉลี่ยขาดทุน ความกดดันทางจิตใจสร้างขึ้น ผู้ที่ซื้อ "ราคาถูก" (ตอนเริ่ม pump) เริ่มทำกำไร ผู้ที่ซื้อที่จุดสูงสุด — กำลังตื่นตกใจ
กฎ: การทะลุต่ำกว่า anchored VWAP บน volume ที่สูงขึ้นเป็นสัญญาณแข็งแกร่งสำหรับการ short หรือการเพิ่มตำแหน่ง
def anchored_vwap(
    candles: list[dict],
    anchor_idx: int,
) -> list[float]:
    """
    Calculate Anchored VWAP from a given point (start of pump).
    """
    vwap_values = []
    cum_vol = 0
    cum_vol_price = 0

    for i in range(anchor_idx, len(candles)):
        c = candles[i]
        typical_price = (c['high'] + c['low'] + c['close']) / 3
        cum_vol += c['volume']
        cum_vol_price += typical_price * c['volume']

        vwap = cum_vol_price / cum_vol if cum_vol > 0 else typical_price
        vwap_values.append(vwap)

    return vwap_values
6. Liquidation Cascades: ปฏิกิริยาลูกโซ่
นี่คือกลไก dump ที่ทรงพลังที่สุด — และทำกำไรสูงสุดสำหรับ short ตรรกะนั้นง่าย:
- นักเทรดเปิด long ด้วย leverage 20x การ liquidation จะเกิดขึ้นหากราคาลดลง 5%
- ราคาลดลง 5% ตำแหน่งถูก liquidate — ตลาดทำการขายด้วยราคาตลาด
- การขายในตลาดผลักราคาให้ต่ำลง ส่งผลให้นักเทรดรายถัดไปถูก liquidate
- และต่อเนื่องไป Cascade
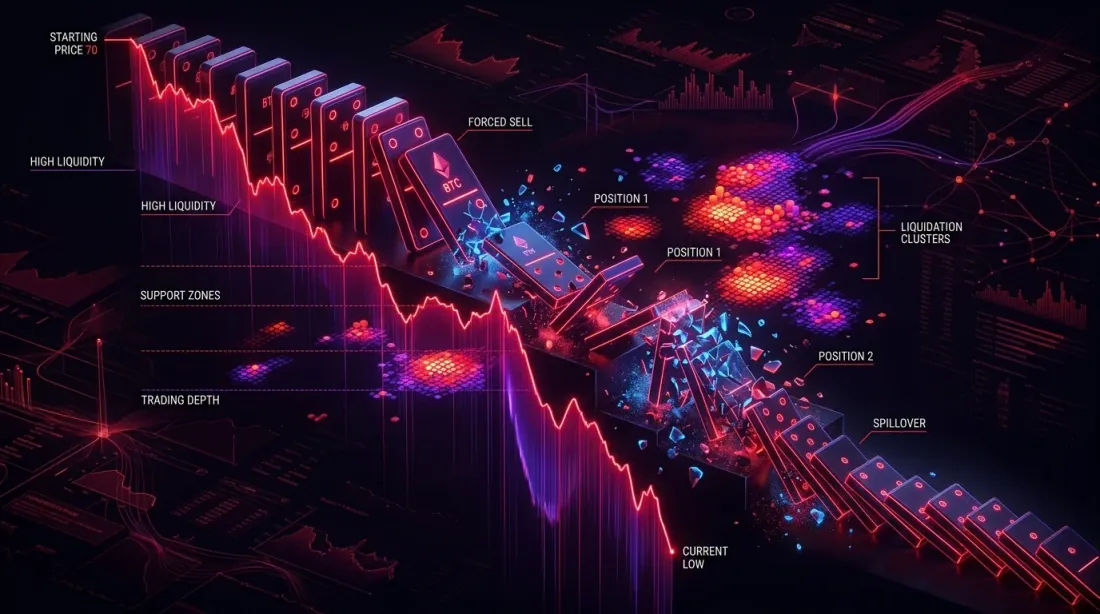
วิธีมองเห็นสิ่งนี้ล่วงหน้า:
CoinGlass Liquidation Heatmap แสดงว่าระดับ liquidation มีความเข้มข้นอยู่ที่ไหน ถ้าใต้ราคาปัจจุบันคุณเห็น "กำแพง" ของ liquidation — การลดลงไปสู่ระดับนั้นมีแนวโน้มสูงที่จะกระตุ้น cascade
| เครื่องมือ | สิ่งที่แสดง | URL |
|---|---|---|
| CoinGlass Heatmap | ระดับ liquidation บนแผนภูมิราคา | coinglass.com/liq/BTC |
| CoinGlass OI | Open Interest ตามตลาด | coinglass.com/open-interest |
| CoinGlass Funding | Funding rates ตามตลาด | coinglass.com/funding-rate |
| Coinalyze | OI + volume + liquidations | coinalyze.net |
| Hyblock Capital | ระดับ liquidation | hyblock.co |
สัญญาณ Cascade: ถ้าในโซน -5% ถึง -15% จากราคาปัจจุบันมี liquidation รวมกันมากกว่า 50-200M) — cascade มีแนวโน้มสูง
อัลกอริทึมปฏิบัติ: ตัวกรอง -> เข้า -> ความเสี่ยง
ทฤษฎีนั้นยอดเยี่ยม ตอนนี้ — pipeline
ขั้นตอนที่ 1: การกรอง (Scanner)
จากโทเคนหลายพัน คุณต้องแยกเฉพาะที่อยู่ในช่วง post-pump เกณฑ์:
def pump_scanner(
    symbols: list[str],
    exchange,  # ccxt exchange instance
    lookback_hours: int = 24,
    min_pump_pct: float = 100,  # minimum +100% over lookback
    min_volume_z: float = 3,    # volume Z-score > 3
) -> list[dict]:
    """
    Scanner for tokens in the post-pump phase.
    """
    import numpy as np

    candidates = []

    for symbol in symbols:
        try:
            candles = exchange.fetch_ohlcv(symbol, '1h', limit=168)  # 7 days
            if len(candles) < 168:
                continue

            closes = [c[4] for c in candles]
            volumes = [c[5] for c in candles]

            recent_closes = closes[-lookback_hours:]
            max_price = max(recent_closes)
            min_price_before = min(closes[:-lookback_hours]) if len(closes) > lookback_hours else closes[0]
            pump_pct = (max_price - min_price_before) / min_price_before * 100

            current_price = closes[-1]
            drawdown_from_peak = (current_price - max_price) / max_price * 100

            vol_baseline = np.mean(volumes[:-lookback_hours])
            vol_std = np.std(volumes[:-lookback_hours])
            vol_recent = np.mean(volumes[-lookback_hours:])
            vol_z = (vol_recent - vol_baseline) / vol_std if vol_std > 0 else 0

            if pump_pct >= min_pump_pct and vol_z >= min_volume_z:
                candidates.append({
                    'symbol': symbol,
                    'pump_pct': round(pump_pct, 1),
                    'drawdown_from_peak': round(drawdown_from_peak, 1),
                    'volume_z_score': round(vol_z, 2),
                    'current_price': current_price,
                    'peak_price': max_price,
                })
        except Exception:
            continue

    candidates.sort(key=lambda x: x['drawdown_from_peak'], reverse=True)
    return candidates
ขั้นตอนที่ 2: การบรรจบของสัญญาณ (Scoring)
สำหรับแต่ละ candidate — การประเมินผ่านพารามิเตอร์ทั้งหกตัว:
def confluence_score(
    funding_signal: dict,
    oi_signal: dict,
    volume_signal: dict,
    pattern_signals: list[dict],
    vwap_position: float,  # price / VWAP (< 1 = below VWAP)
    liquidation_density: float,  # $M liquidations below current price
) -> dict:
    """
    Composite score for short entry.
    Score 0-6, where each factor = 0 or 1 point.
    """
    score = 0
    reasons = []

    if funding_signal['signal'] in ('extreme', 'insane'):
        score += 1
        reasons.append(f"Funding z-score: {funding_signal['z_score']}")

    if oi_signal['trapped_longs']:
        score += 1
        reasons.append(f"Trapped longs: OI percentile {oi_signal['oi_percentile']}")

    if volume_signal['signal'] == 'exhaustion':
        score += 1
        reasons.append(f"Volume degradation: {volume_signal['volume_degradation_pct']}%")

    strong_patterns = [p for p in pattern_signals if p['strength'] > 0.6]
    if strong_patterns:
        score += 1
        reasons.append(f"Pattern: {strong_patterns[-1]['pattern']}")

    if vwap_position < 0.98:  # price 2%+ below VWAP
        score += 1
        reasons.append(f"Below VWAP: {round((1 - vwap_position) * 100, 1)}%")

    if liquidation_density > 5:  # > $5M liquidations
        score += 1
        reasons.append(f"Liquidation density: ${liquidation_density}M")

    if score >= 4:
        action = 'strong_short'
    elif score >= 3:
        action = 'short'
    elif score >= 2:
        action = 'watch'
    else:
        action = 'skip'

    return {
        'score': score,
        'max_score': 6,
        'action': action,
        'reasons': reasons,
    }
ขั้นตอนที่ 3: การเข้าและการจัดการความเสี่ยง
การเข้า:
- Score >= 4: เข้าด้วย 50% ของตำแหน่ง
- Score = 3: เข้าด้วย 25% ของตำแหน่ง
- Score < 3: รอ
Stop-loss:
- เหนือ swing high ล่าสุด + บัฟเฟอร์ 1-2%
- ไม่ใช่ stop แบบแคบ ความผันผวนบน shitcoin จะฆ่าคุณ ขั้นต่ำ 5-10% จากจุดเข้า
- ที่ Score = 6 stop ที่ 8-12% ยอมรับได้ (ความมั่นใจมากขึ้น = stop กว้างขึ้น แต่ leverage น้อยลง)
Take-profit:
- TP1 (50% ของตำแหน่ง): แนวรับสำคัญถัดไปหรือ -20% จากจุดเข้า
- TP2 (30% ของตำแหน่ง): VWAP จากจุดเริ่มต้นของ pump
- TP3 (20% ของตำแหน่ง): ระดับก่อน pump
ขนาดตำแหน่ง:
ด้วยทุน $10,000, ความเสี่ยง 2% ต่อการเทรด และ stop 8%:
ด้วย leverage 3x: คุณเสี่ยง 500-$1,250 (TP1-TP3)
Leverage สูงสุด: 3-5x ไม่มากกว่านี้ จริงๆ Shitcoin ในช่วง pump สามารถทำ +50% อีกครั้ง หลังจาก "ตัวชี้วัดทั้งหมดบอกให้ short" leverage สูง = liquidation
สิ่งที่ไม่ควรทำ: บาปมรณะห้าประการ
1. ห้าม short ในช่วง pump
"แต่มันต้องลงแน่นอน!" — ใช่ มันจะลง แต่เมื่อไหร่? ถ้าคุณเข้า short ที่ +200% และราคาทำ +600% ก่อนที่จะลงมาที่ +150% — คุณถูก liquidate ที่ +450% ในทางเทคนิคคุณถูกต้อง ในทางปฏิบัติ — ล้มละลาย
กฎ: เข้าเฉพาะหลังการดึงกลับครั้งแรกที่มีนัยสำคัญ (-15% หรือมากกว่าจากจุดสูงสุด) และการก่อตัวของโครงสร้างการกลับตัว
2. ห้ามใช้ stop-loss แบบแคบ
Stop-loss 2% บน shitcoin ที่มี ATR 15% ไม่ใช่การจัดการความเสี่ยง — มันคือการบริจาคให้ market maker Stop ของคุณจะถูก hit ภายในไม่กี่นาทีในช่วง wick ที่ผันผวนครั้งถัดไป
กฎ: stop-loss >= 1.5 x ATR ของ timeframe ปัจจุบัน ในอุดมคติ 2x
3. ห้ามเดิมพันทุกอย่างในการเทรดเดียว
แม้กระทั่งด้วย Score 6/6 ความน่าจะเป็นของความสำเร็จอยู่ที่ประมาณ 65-70% หมายความว่า 3 ใน 10 การเทรดเป็นการขาดทุน ถ้าคุณใส่ 10% ของทุนในแต่ละครั้ง — การขาดทุนสามครั้งติดต่อกัน = drawdown -30% หลังจากนั้น คุณจะเริ่มเทรดแย่ลงในเชิงจิตวิทยา
กฎ: 1-2% ของทุนต่อการเทรด สูงสุด 5% เมื่อมีความมั่นใจสูงมาก
4. ห้ามละเลยสภาพคล่อง
คุณไม่ใช่ Goldman Sachs ถ้า volume รายวันของโทเคนคือ 50K — คุณกลายเป็นเหตุการณ์ตลาด การเข้าของคุณขยับราคา การออกของคุณขยับราคา Slippage กินกำไรทั้งหมด
กฎ: ขนาดตำแหน่ง <= 1% ของ volume รายวันของโทเคน
5. ห้าม short บนตลาด spot โดยไม่มีความสามารถ short
สิ่งนี้ดูเหมือนชัดเจน แต่จำนวนคนที่ "short" โดยการซื้อโทเคน inverse บน DEX หรือโดย "ขาย spot ที่วางแผนจะซื้อกลับให้ถูกกว่า" นั้นน่าตกตะลึง ใช้ futures บนตลาดที่มีสภาพคล่องที่เหมาะสม หรือไม่ก็ไม่ต้อง short เลย
เครื่องมือติดตาม
CoinGlass (coinglass.com)
เครื่องมือหลักสำหรับการวิเคราะห์ futures:
- Liquidation Heatmap: การแสดงภาพระดับ liquidation บนแผนภูมิราคา
- Funding Rate: การเปรียบเทียบ funding rate ข้ามตลาดแบบ real time
- Open Interest: OI รวมตามตลาด
- Long/Short Ratio: อัตราส่วนของ long ต่อ short (ตามจำนวนบัญชีและตาม volume)
Coinalyze (coinalyze.net)
การวิเคราะห์ derivatives เชิงลึก:
- Aggregated OI: Open Interest รวมแบ่งตามตลาด
- Liquidations: ประวัติ liquidation แบ่งตาม long/short
- OI-weighted Funding Rate: funding rate ที่แม่นยำกว่าโดยคิดตามส่วนแบ่งของแต่ละตลาด
TradingView (tradingview.com)
สำหรับการวิเคราะห์แผนภูมิ:
- Pine Script สำหรับการทำให้รูปแบบแท่งเทียนอัตโนมัติ
- Anchored VWAP (เครื่องมือในตัว)
- การวางซ้อนข้อมูล CoinGlass ผ่าน community indicators
Laevitas (laevitas.ch)
เทอร์มินัล derivatives ระดับมืออาชีพ:
- Gamma exposure
- Options flow
- OI heatmap ตาม strike
การทำให้อัตโนมัติด้วย AI Agents
ทุกอย่างที่อธิบายไว้ข้างต้นสามารถ (และควร) ถูกทำให้อัตโนมัติ นี่คือสถาปัตยกรรมระบบตรวจจับ:
import asyncio
import numpy as np
from dataclasses import dataclass
from enum import Enum

class AlertLevel(Enum):
    WATCH = "watch"
    PREPARE = "prepare"
    ENTRY = "entry"

@dataclass
class PumpDumpAlert:
    symbol: str
    level: AlertLevel
    score: int
    reasons: list[str]
    suggested_entry: float | None
    suggested_stop: float | None
    suggested_tp: list[float]
    timestamp: float

class PumpDumpDetector:
    """
    AI agent for detecting post-pump dumps.

    Pipeline:
    1. Scanning: volume Z-score > 3 + price increase > 100%
    2. Filtering: funding spike + OI growth
    3. Waiting: reversal pattern on 5m/15m
    4. Alert: scoring -> notification
    """

    def __init__(
        self,
        exchange,
        symbols: list[str],
        volume_z_threshold: float = 3.0,
        funding_z_threshold: float = 2.0,
        min_pump_pct: float = 80.0,
        scan_interval_sec: int = 60,
    ):
        self.exchange = exchange
        self.symbols = symbols
        self.volume_z_threshold = volume_z_threshold
        self.funding_z_threshold = funding_z_threshold
        self.min_pump_pct = min_pump_pct
        self.scan_interval_sec = scan_interval_sec
        self.active_watches: dict[str, dict] = {}

    async def scan_loop(self):
        """Main scanning loop."""
        while True:
            candidates = await self._broad_scan()

            for candidate in candidates:
                symbol = candidate['symbol']

                if symbol not in self.active_watches:
                    self.active_watches[symbol] = {
                        'first_seen': asyncio.get_event_loop().time(),
                        'pump_peak': candidate['peak_price'],
                        'pump_start_approx': candidate.get('pump_start_price'),
                    }
                    await self._emit_alert(PumpDumpAlert(
                        symbol=symbol,
                        level=AlertLevel.WATCH,
                        score=0,
                        reasons=[f"Pump detected: +{candidate['pump_pct']}%"],
                        suggested_entry=None,
                        suggested_stop=None,
                        suggested_tp=[],
                        timestamp=asyncio.get_event_loop().time(),
                    ))

                analysis = await self._deep_analysis(symbol)

                if analysis['score'] >= 3:
                    entry = candidate['current_price']
                    stop = candidate['peak_price'] * 1.02  # 2% above peak

                    await self._emit_alert(PumpDumpAlert(
                        symbol=symbol,
                        level=AlertLevel.ENTRY if analysis['score'] >= 4 else AlertLevel.PREPARE,
                        score=analysis['score'],
                        reasons=analysis['reasons'],
                        suggested_entry=entry,
                        suggested_stop=stop,
                        suggested_tp=[
                            entry * 0.80,  # TP1: -20%
                            entry * 0.65,  # TP2: -35%
                            entry * 0.50,  # TP3: -50%
                        ],
                        timestamp=asyncio.get_event_loop().time(),
                    ))

            current_time = asyncio.get_event_loop().time()
            self.active_watches = {
                s: d for s, d in self.active_watches.items()
                if current_time - d['first_seen'] < 48 * 3600
            }

            await asyncio.sleep(self.scan_interval_sec)

    async def _broad_scan(self) -> list[dict]:
        """Quick scan of all symbols."""
        ...

    async def _deep_analysis(self, symbol: str) -> dict:
        """
        Deep analysis of a specific symbol.
        Collects all 6 signals and computes confluence score.
        """
        funding = await self._get_funding_signal(symbol)

        oi = await self._get_oi_signal(symbol)

        volume = await self._get_volume_signal(symbol)

        patterns = await self._get_pattern_signals(symbol, timeframe='5m')

        vwap_pos = await self._get_vwap_position(symbol)

        liq_density = await self._get_liquidation_density(symbol)

        return confluence_score(
            funding, oi, volume, patterns, vwap_pos, liq_density
        )

    async def _emit_alert(self, alert: PumpDumpAlert):
        """Send alert (Telegram, webhook, etc.)."""
        print(f"[{alert.level.value.upper()}] {alert.symbol} "
              f"Score: {alert.score}/6 | {', '.join(alert.reasons)}")
        ...
เกณฑ์สำคัญสำหรับการทำให้อัตโนมัติ
| พารามิเตอร์ | เกณฑ์ WATCH | เกณฑ์ ENTRY |
|---|---|---|
| Volume Z-score | > 3 | > 5 |
| Funding Rate Z-score | > 2 | > 3 |
| การเติบโตของ OI ใน 4 ชั่วโมง | > 50% | > 100% |
| ราคาจากจุดสูงสุด | -5% ถึง -15% | -15% ถึง -30% |
| รูปแบบแท่งเทียน | ใดก็ได้ | แข็งแกร่ง (strength > 0.6) |
| ราคา vs VWAP | ใกล้ VWAP | ต่ำกว่า 2%+ |
สถิติและความเป็นจริง
มาพูดกันตรงๆ กลยุทธ์นี้ไม่ใช่ holy grail นี่คือสถิติ backtest โดยประมาณบนข้อมูลปี 2024-2025:
| เมตริก | ค่า |
|---|---|
| Win rate (score >= 4) | ~62-68% |
| กำไรเฉลี่ย | +18-25% |
| ขาดทุนเฉลี่ย | -8-12% |
| Profit factor | 1.8-2.3 |
| Max drawdown | -15-22% |
| Sharpe ratio | 1.1-1.6 |
ข้อจำกัดสำคัญ:
-
Survivorship bias: เราวิเคราะห์เฉพาะโทเคนที่ซื้อขายบนตลาด futures pump-and-dump ที่บ้าที่สุดเกิดขึ้นบน DEX ซึ่งการ short เป็นไปไม่ได้
-
สภาพคล่อง: บน futures shitcoin หลายตัว ไม่มีสภาพคล่องเพียงพอสำหรับขนาดตำแหน่งที่มีนัยสำคัญ Slippage อาจกินกำไร 2-5%
-
การต่อสู้กับ market maker: MM มืออาชีพรู้รูปแบบเหล่านี้และใช้มันอย่างจริงจังเพื่อล่า stop-loss ของผู้ short การ pump ปลอมหลังจากรูปแบบการกลับตัวก่อตัว — นั่นคือการเล่นมาตรฐาน
-
Black swan บน short: ในทางทฤษฎี short มีศักยภาพขาดทุนไม่จำกัด ในทางปฏิบัติ stop-loss แก้ปัญหา — แต่ในช่วงที่มีสภาพคล่องต่ำ stop อาจ fill แย่กว่าราคาที่ระบุมาก
สรุป
การ short dump หลัง shitcoin pump เป็นหนึ่งในกลยุทธ์ไม่กี่อย่างในคริปโตที่ edge (ความได้เปรียบทางสถิติ) มีอยู่จริง เหตุผล: ความไร้เหตุผลของนักเทรดรายย่อยในวงกว้างสร้างรูปแบบที่คาดเดาได้ และกลไกของ liquidation cascade ขยายการเคลื่อนไหวในทิศทางของคุณ
กฎสามข้อที่ต้องจำ:
-
ห้าม short ใน impulse รอช่วงที่ 3 รอรูปแบบการกลับตัว รอ OI divergence ความอดทนคือเครื่องมือหลักของคุณ ไม่ใช่ตัวชี้วัดฉลาดๆ
-
ใช้การบรรจบของสัญญาณ ตัวชี้วัดหนึ่งตัวคือสัญญาณรบกวน สองตัวคือสมมติฐาน สี่ตัวขึ้นไปคือ setup ที่ซื้อขายได้ Funding + OI + รูปแบบ + VWAP = เข้า
-
จัดการขนาดตำแหน่ง ไม่ใช่ leverage ความเสี่ยง 2% ต่อการเทรด leverage สูงสุด 3-5x stop-loss >= 1.5 ATR น่าเบื่อ? ใช่ แต่นักเทรดที่น่าเบื่อเป็นกลุ่มเดียวที่ยังอยู่ในตลาดหนึ่งปีต่อมา
และสิ่งสุดท้าย จำไว้: เบื้องหลัง dump ทุกครั้ง มีคนจริงๆ ที่เสียเงินจริงๆ หลายคนเป็นมือใหม่ที่ยอมแพ้ต่อ FOMO เราวิเคราะห์กลไกตลาด ไม่ใช่สนับสนุนการปั่นตลาด การทำกำไรจากความไร้ประสิทธิภาพเป็นสิ่งที่ถูกต้อง การสร้างความไร้ประสิทธิภาพนั้นไม่ใช่
สำหรับข้อมูลเพิ่มเติมเกี่ยวกับ funding rate และผลกระทบต่อ leverage ดูบทความของเรา Funding Rates Kill Your Leverage เกี่ยวกับวิธีการตรวจจับความผิดปกติในการเทรด — Anomaly Detection for Protecting Trading Bots เกี่ยวกับ funding rate arbitrage ระหว่างตลาด — Cross-Exchange Funding Rate Arbitrage
ลิงก์ที่เป็นประโยชน์
- CoinGlass — Liquidation Heatmap
- CoinGlass — Funding Rate
- CoinGlass — Open Interest
- Coinalyze — Aggregated Open Interest
- Hyblock Capital — Liquidation Levels
- Laevitas — Derivatives Analytics
- TradingView — Anchored VWAP
- Binance — Funding Rate History
การอ้างอิง
@article{soloviov2026shitcoinpumpdump,
  author = {Soloviov, Eugen},
  title = {วิธีจับการลงหลัง Shitcoin Pump: แนวทางเชิงระบบ},
  year = {2026},
  url = {https://marketmaker.cc/th/blog/post/shitcoin-pump-dump-strategies},
  version = {0.1.0},
  description = {การวิเคราะห์เชิงระบบของกลยุทธ์ short หลัง shitcoin pump ครอบคลุม Funding rate, OI, การวิเคราะห์ volume, รูปแบบแท่งเทียน, liquidation cascades พร้อมอัลกอริทึมปฏิบัติ}
}
ผู้เขียน

Trading-systems engineer
Trading-systems engineer building bots since 2017: cross-exchange arbitrage (connected up to 30 venues), cointegration-based pairs arbitrage across spot and futures, scalping, news and sentiment-driven strategies, trend algorithms, and portfolio management and balancing algorithms. Also builds sub-millisecond order execution, big-data warehouses, backtesting engines, AI agents, and trading interfaces (incl. open-source profitmaker.cc). Stack: JS/TS, Python, Rust/Zig/Go, DevOps, backend, frontend, architecture.
อ่านเพิ่มเติม
Statistical Arbitrage และ Pairs Trading ในตลาด Crypto: จาก Cointegration สู่ Kalman Filter

Funding Rate ทำลาย Leverage ของคุณ: ทำไม PnL×50x ถึงเป็นแค่ภาพลวงตา